US solar market bounced back in Q3 2020, report says –
US solar market bounced back in Q3 2020, report says –

U.S. solar companies installed 3.8 gigawatts (GW) of new solar capacity in Q3 2020, a 9% increase from Q2 installations as the industry experienced a recovery from the worst impacts of the COVID-19 pandemic.
According to the U.S. Solar Market Insight Q4 2020 report, released today by the Solar Energy Industries Association (SEIA) and Wood Mackenzie, solar accounted for 43% of all new electric generating capacity additions through Q3 2020, more than any other electricity source. The report projects a record 19 GW of new solar capacity installations in 2020, representing 43% year-over-year growth from 2019.
“This report points to the incredible resilience of our companies and workers in the face of the pandemic and continued demand for clean, affordable electricity sources,” said Abigail Ross Hopper, president and CEO of the Solar Energy Industries Association.
“It also speaks to our ability to support economic growth, even in our darkest moments. While solar will continue to grow, the next administration and Congress have an opportunity to help the solar industry reach its Solar+ Decade goals, creating hundreds of thousands of jobs and tackling the climate crisis.”
The residential solar market — which was the hardest hit by the business impacts of the pandemic — beat recovery expectations, growing 14% over Q2 but remained below Q1 levels.
“Logically, the states with the biggest installation declines in Q2 also had the biggest recoveries in Q3, such as New York and New Jersey where restrictions were substantial,” said Michelle Davis, senior analyst at Wood Mackenzie. “Business model adaptations, such as virtual sales tactics and pricing promotions, continued to pay dividends through the summer and fall.”
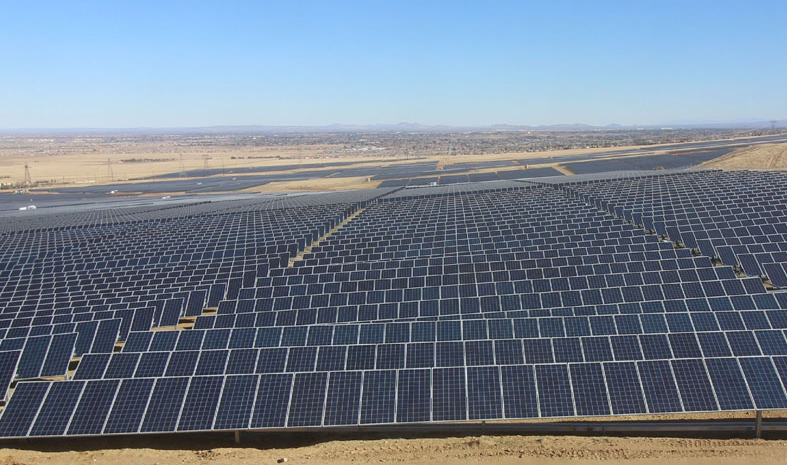
The utility-scale market was the primary driver of Q3 installations with 2.7 GW of new capacity, representing 70% of all solar capacity brought online in Q3.
Sun Belt states are leading the way on new capacity additions this year, with Texas and Florida both installing more than 2 GW through Q3 2020. For perspective, that is nearly the amount of solar that each of those states installed over 2018 and 2019 combined.
The utility-scale project pipeline ballooned to a record 69.2 GW, and the U.S. is now forecast to reach 100 GW of cumulative installed solar capacity by mid-2021.
Key Figures:
- In Q3 2020, the U.S. solar market installed 3.8 GWdc of solar PV, up 9% from Q2 as the industry began recovering from the worst impacts of the pandemic.
- A total of 9.5 GWdc of new utility PV power purchase agreements were announced in Q3 2020, bringing the contracted pipeline to a record total of 69 GWdc
- Solar has accounted for 43% of all new electricity generating capacity added in the U.S. through the third quarter this year, beating out all other generation technologies.
- Wood Mackenzie forecasts 43% annual growth in 2020, with more than 19 GWdc of installations expected.
- Forecasts for 2021-2025 put total solar installations above 107 GWdc, a 10 GWdc increase from last quarter driven primarily by healthy increases to the utility-scale solar pipeline.


